When you enter the world of investing, you are surrounded by promises of enormous profits in a very short time. Social media is full of screenshots showing hundreds of percent gains from individual stocks or highly volatile assets. The reality of successful long-term investing looks very different.
The stock market is not a casino or a get-rich-quick scheme. It is a mechanism for accumulating capital by participating in the growth of businesses and economies over time. Historical returns can help set realistic expectations, but they do not guarantee future results.
If you are building a long-term portfolio, Tracking performance can help you understand whether your results are consistent with your investment plan.
The myth of getting rich quickly
Unrealistic expectations can push investors toward excessive risk. If you expect to double your money every year, you may be tempted to buy highly speculative stocks, trade excessively, or use leverage.
A different approach is to invest broadly through major market indexes such as the S&P 500, MSCI World, or FTSE All-World. These investments are not designed to make you rich in a month. Their potential comes from compounding returns over many years and decades.
The important question is therefore not "How much can I make next year?" but rather:
What range of returns has historically been achievable over long periods, and what should I reasonably expect from a diversified portfolio?
Historical returns: S&P 500, MSCI World, and FTSE All-World
The S&P 500 tracks approximately 500 large U.S. companies and represents a substantial portion of the U.S. stock market.
The MSCI World contains more than 1,500 large- and mid-cap companies across developed markets.
The FTSE All-World provides broader geographical diversification, covering thousands of large- and mid-cap companies from both developed and emerging markets.
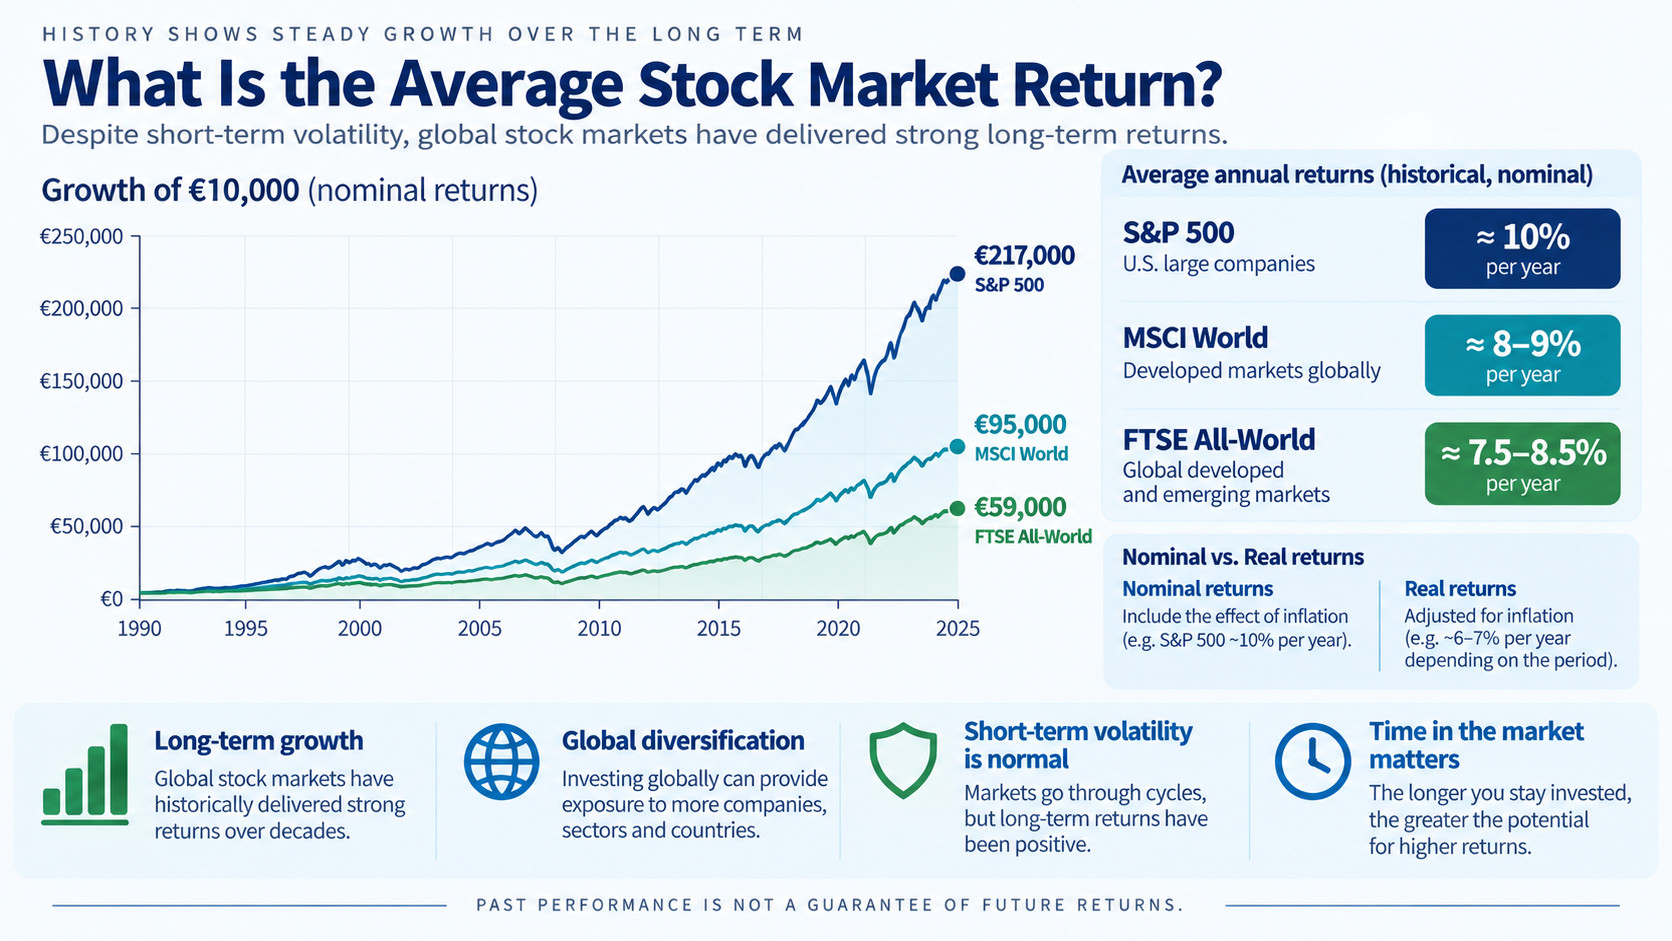
Over long historical periods, the source data used for this guide put average nominal annual returns at approximately:
- S&P 500: around 10% per year, including reinvested dividends
- MSCI World: around 8–9% per year
- FTSE All-World: around 7.5–8.5% per year
These are long-term averages. They do not mean that the market produces the same return every year.
What happens over 10 years?
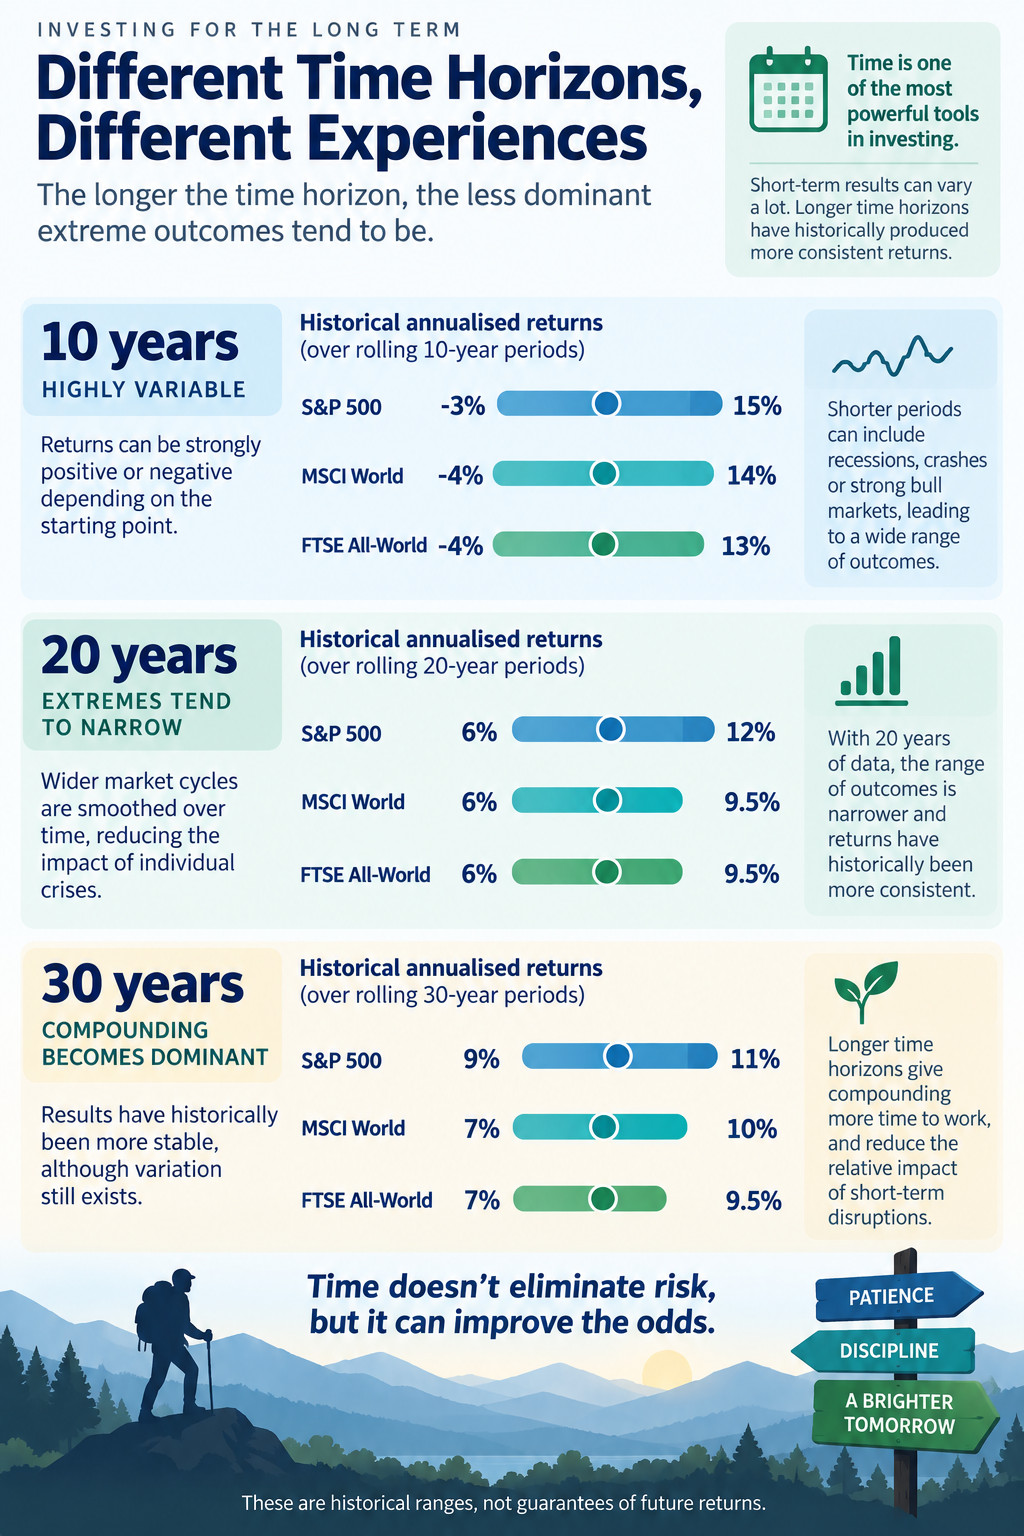
Ten years is a meaningful investment horizon, but it is still long enough for the starting point to have a major influence on the result.
For example, an investment covering roughly 2000–2010 included both the dot-com crash and the 2008 financial crisis. The S&P 500 produced a result close to zero or slightly negative over that period, while global markets were also severely affected.
By contrast, the 2010–2020 period produced annualised returns above 13% for U.S. equities and around 10% for global indexes according to the source data.
This illustrates an important point:
A long-term average can hide very different experiences for investors who start at different points in the market cycle.
What happens over 20 years?
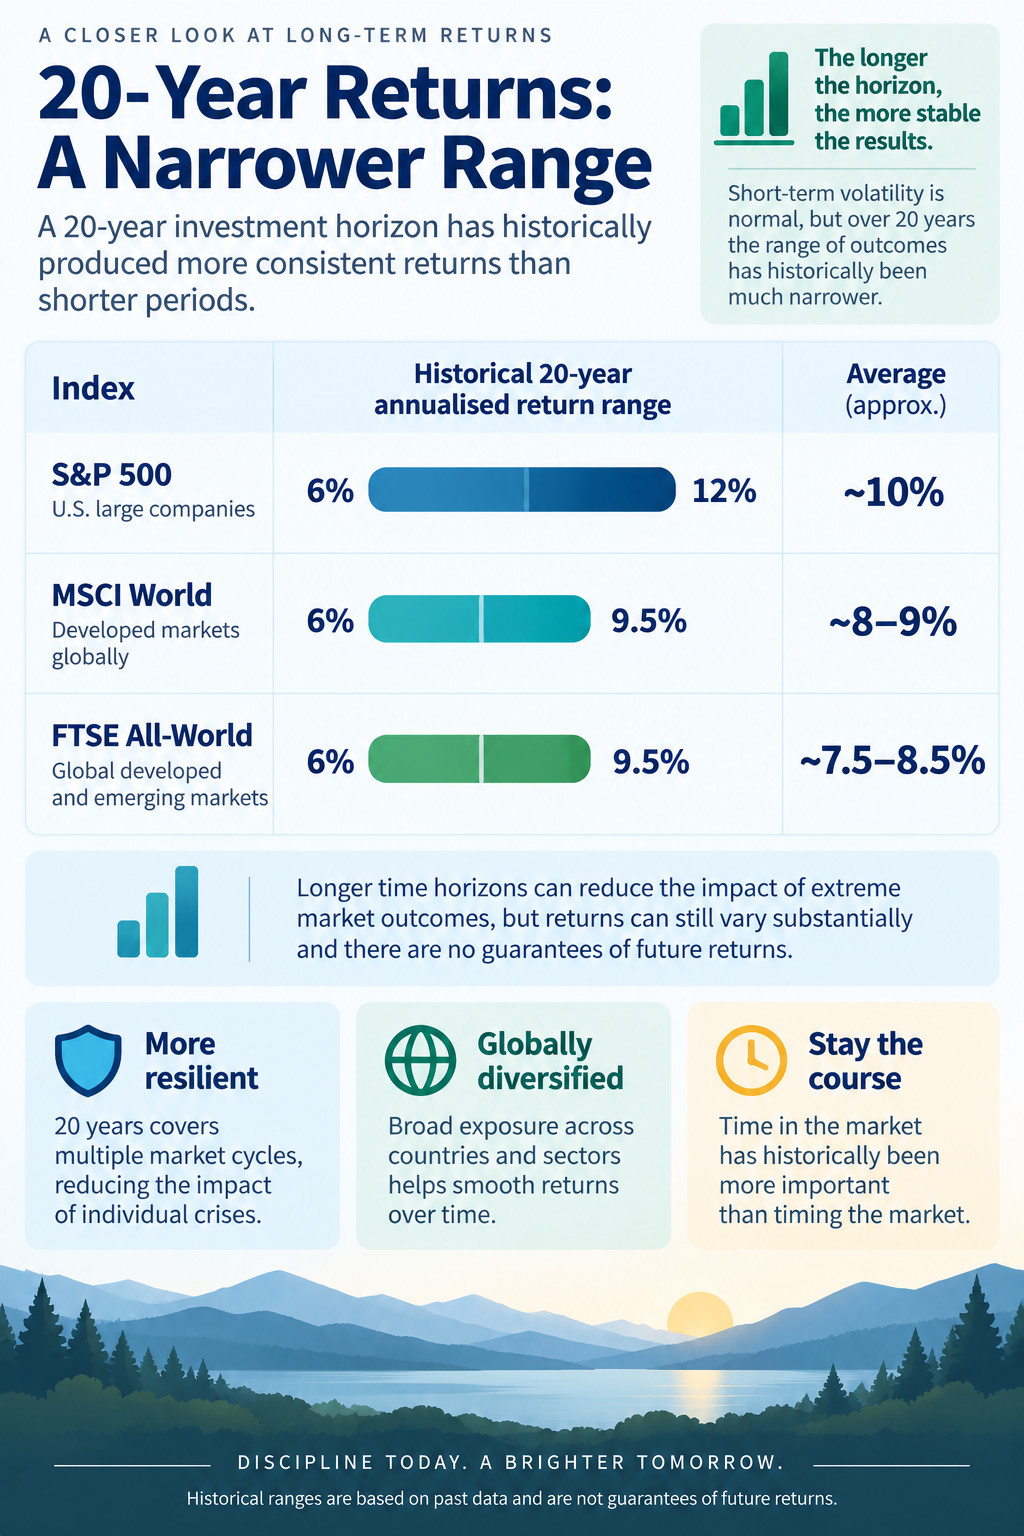
As the investment horizon increases, extreme outcomes tend to become less dominant.
The source data place historical 20-year annualised nominal returns for the S&P 500 roughly in the 6–12% range. For MSCI World and FTSE All-World, the historical ranges presented are approximately 6–9.5% per year.
Longer periods also give dividends and reinvested returns more time to compound.
What happens over 30 years?
At a 30-year horizon, compounding becomes increasingly important.
The historical figures presented in the source place long-term annual nominal returns at approximately:
- S&P 500: around 10%
- MSCI World: around 8–9%
- FTSE All-World: around 8–9%
Market crashes, recessions, wars, and other disruptions can still occur during a 30-year period. The difference is that an investor has substantially more time for subsequent market growth to offset temporary declines.
The key lesson is not that markets become predictable over 30 years. It is that time can reduce the relative impact of individual market episodes on the overall result.
Nominal return vs. real return
One of the most important distinctions in investing is the difference between nominal and real returns.
Suppose your portfolio increases by 10% in a year while the general price level also increases by 10%. Your account balance is higher, but your purchasing power has not increased by the same amount.
The real return adjusts investment performance for inflation.
A simplified approximation is:
Real return ≈ nominal return − inflation
For example, a 8% nominal return combined with 3% inflation corresponds to roughly a 5% real return. The exact calculation is slightly different because returns compound.
The historical figures presented in the source are approximately:
| Index | Horizon | Average nominal annual return | Average real annual return |
|---|---|---|---|
| S&P 500 | 10 years, variable | 0%–15% | −3%–12% |
| S&P 500 | 20 years | 6%–12% | 3%–9% |
| S&P 500 | 30 years | 9%–11% | 6%–8% |
| MSCI World | 20+ years | 8%–9% | 5%–6% |
| FTSE All-World | 20+ years | 7.5%–8.5% | 5%–5.5% |
These ranges are historical illustrations rather than forecasts.
Volatility is part of the return
Many investors want 8–10% annual returns but imagine that their portfolio should rise smoothly every month.
Markets do not work that way.
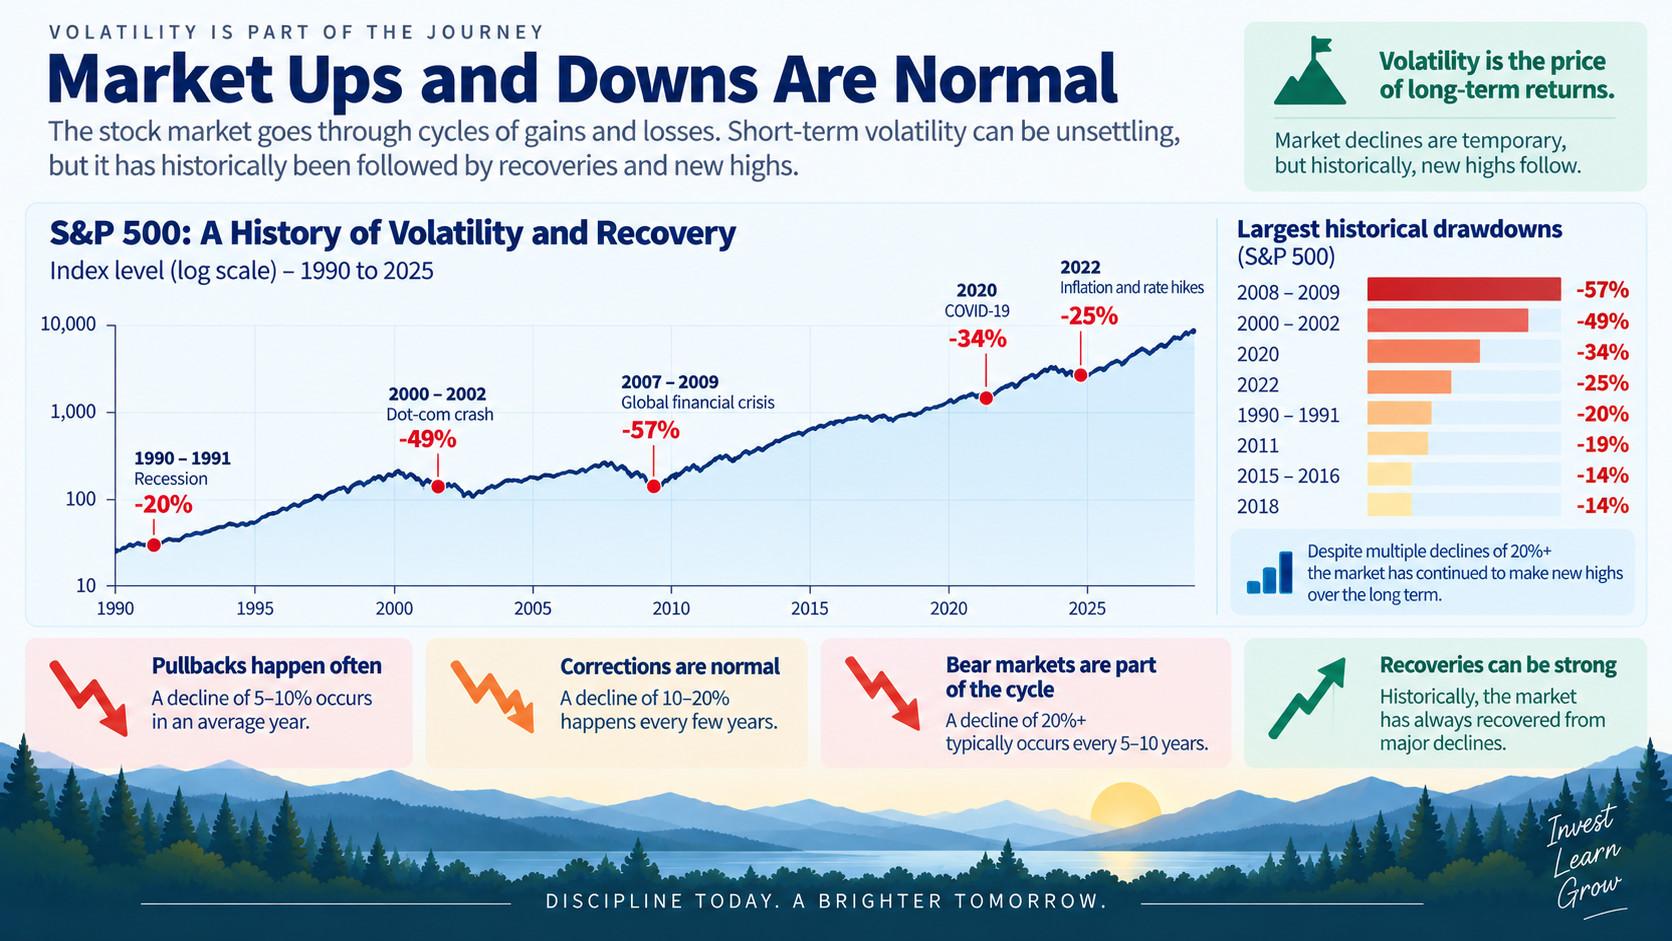
Stock prices fluctuate constantly, and even years that finish with positive returns can contain substantial temporary declines. The source highlights an average intra-year drawdown of roughly 14% for global equity markets, illustrating how normal it can be for prices to fall significantly before recovering.
A temporary decline does not necessarily mean that a long-term investment thesis has failed.
This distinction is crucial:
Annual return measures where the market ended. Drawdown measures what an investor had to endure along the way.
S&P 500 annual total returns, 2006–2025
Annual total returns include both price changes and dividends. The S&P 500 had positive total returns in 17 of these 20 calendar years.
Source: S&P Dow Jones Indices; annual total returns in USD.
Understanding bear markets
A bear market is commonly defined as a decline of at least 20% from a previous market high.
These periods can be psychologically difficult because losses are visible in real time while the eventual recovery is unknown.
Several major examples illustrate the scale of historical declines:
- Dot-com crash (2000–2002): The S&P 500 fell by approximately 47% during the downturn.
- Global Financial Crisis (2007–2009): The S&P 500 and global equity markets experienced declines exceeding 50%.
- COVID-19 crash (2020): Global uncertainty produced one of the fastest declines of more than 30% in modern market history, followed by a rapid recovery.
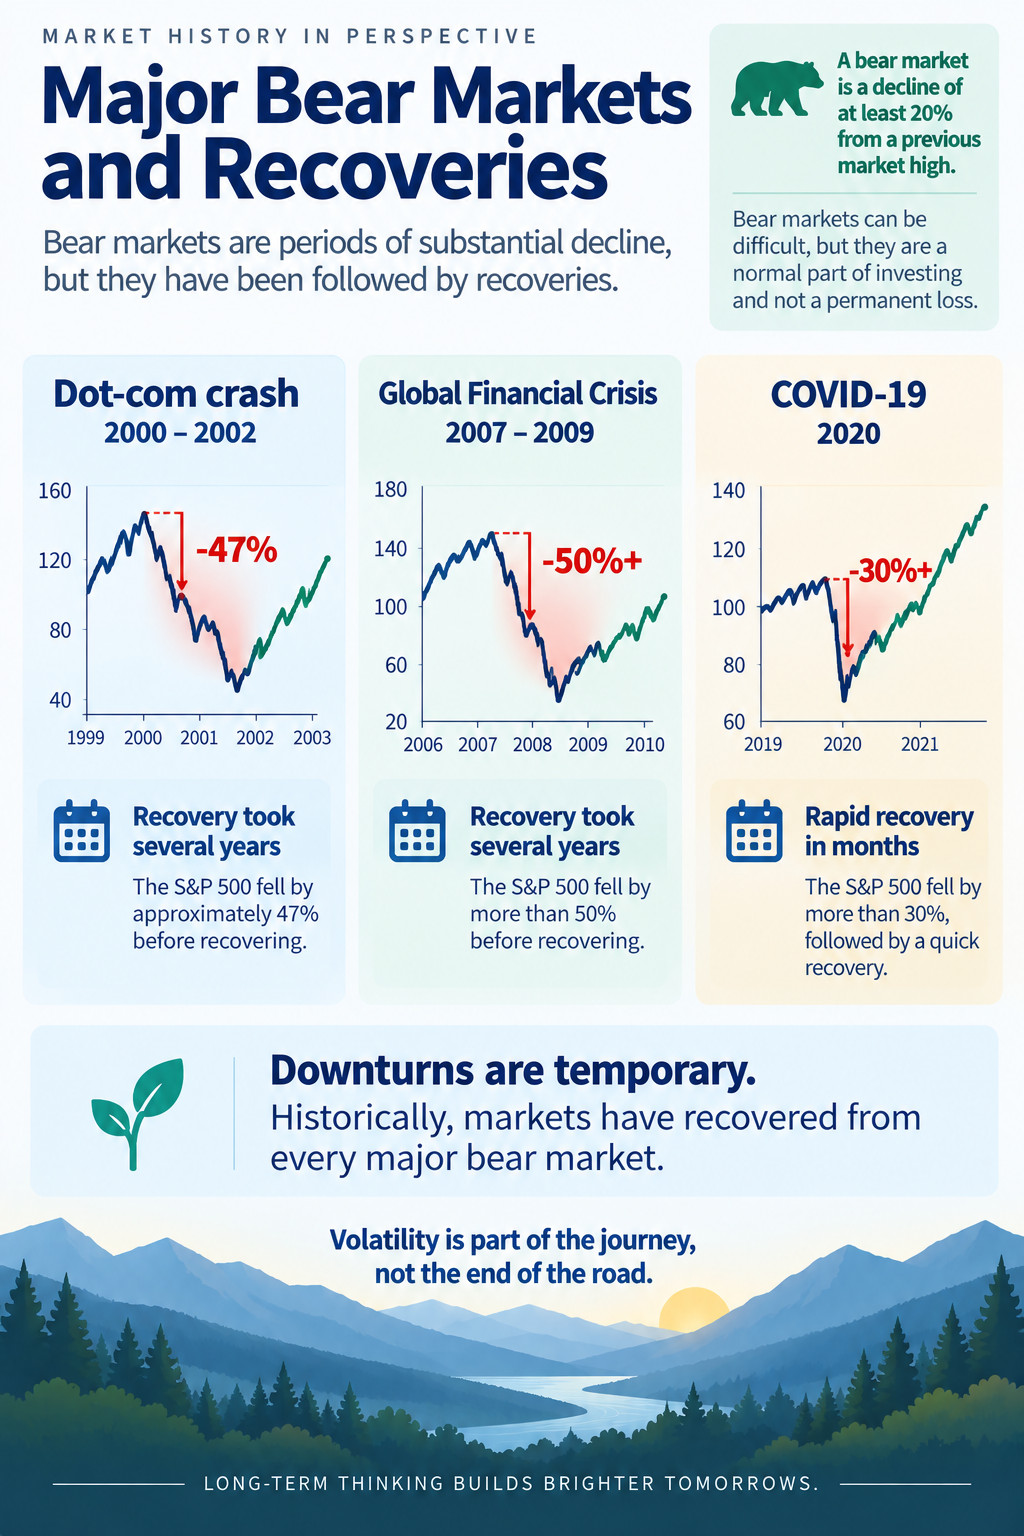
These episodes demonstrate why a long-term investor needs to consider not only expected returns but also the size of temporary losses that may occur along the way.
Why investor behaviour matters
If broad market indexes have historically produced strong long-term returns, why do individual investors often achieve different results?
One explanation is behaviour.
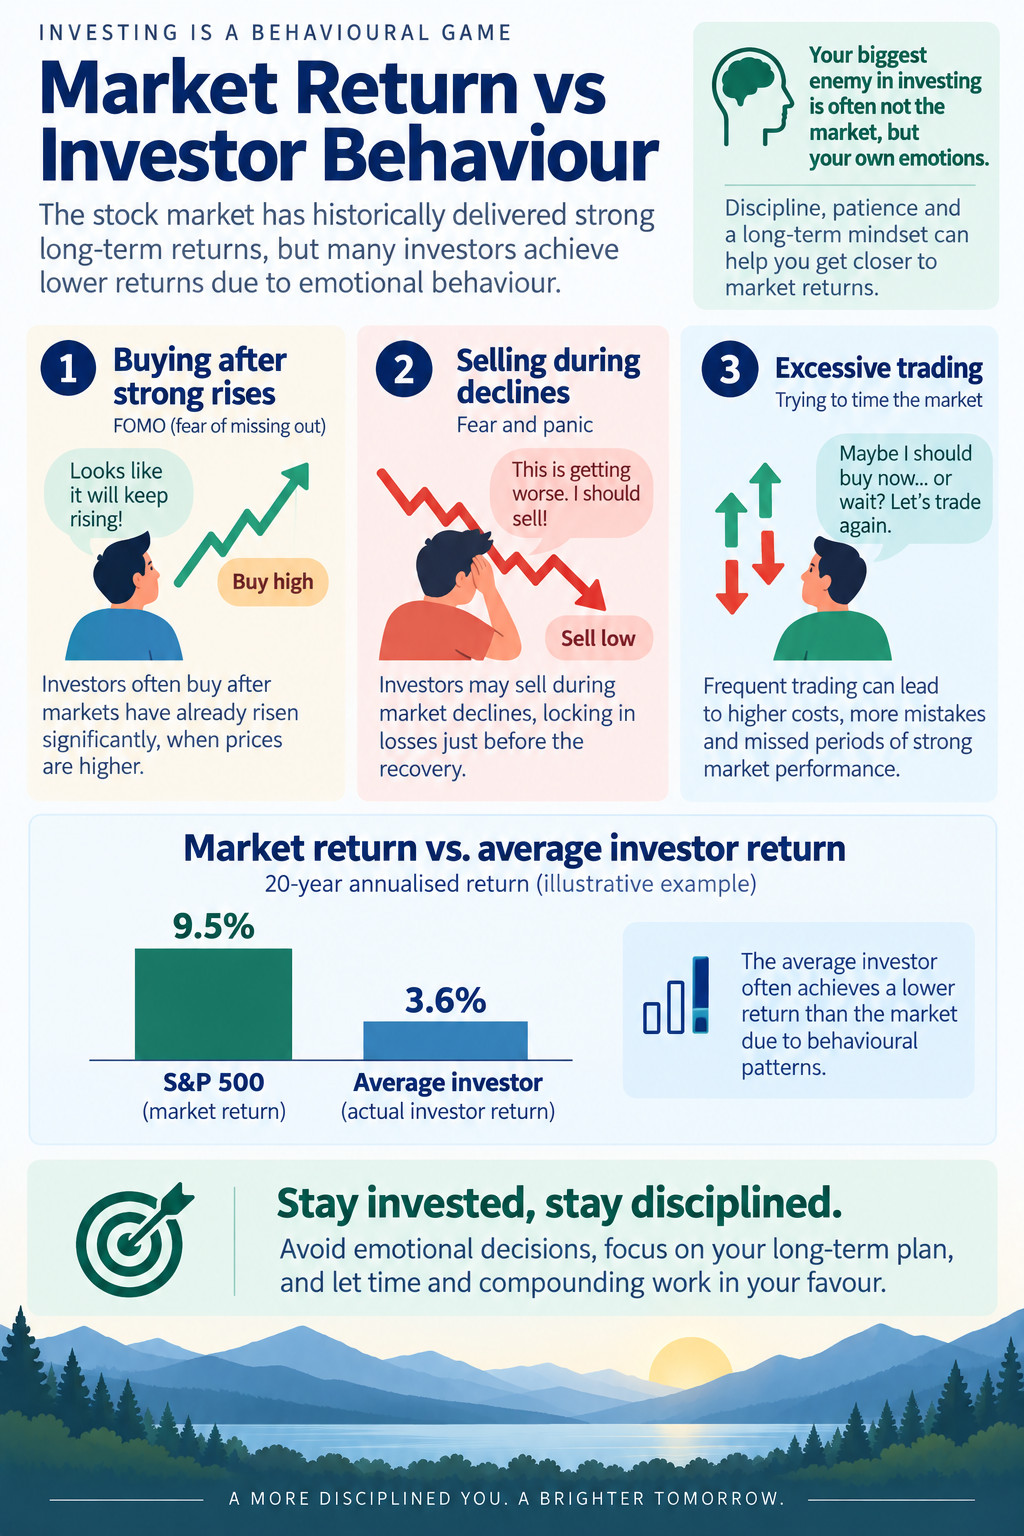
The source highlights a substantial gap between market returns and the returns actually achieved by the average investor. It gives an example in which the S&P 500 generated an average annual return of approximately 9.5% over a 20-year period while the average investor achieved only about 3.6%.
The underlying behavioural patterns described include:
- Buying after strong market increases: Investors can become more confident after markets have already risen substantially and enter at elevated prices.
- Selling during major declines: Fear can cause investors to sell after prices have already fallen sharply.
- Excessive trading: Attempts to predict the perfect entry and exit points can lead to additional costs and missed periods of strong market performance.
The danger of missing the recovery
Consider an investor who sells a globally diversified portfolio during a major market decline because they are afraid that prices will fall further.
If the market subsequently recovers while the investor remains in cash, the investor faces a difficult decision: buy back at higher prices or continue waiting for another decline.
A temporary loss can therefore become a permanent realised loss if the investor sells and fails to participate in the subsequent recovery.
How to use historical returns when building a plan
Historical returns can provide useful assumptions, but they should not be treated as promises.
Several principles from the source can help investors build a long-term process.
Use an appropriate time horizon
Money needed in the next few years for a house deposit, major purchase, or other known expense generally should not be exposed to the same level of equity-market volatility as money intended for a distant financial goal.
The source suggests considering equities primarily for objectives more than 10 years away.
Invest consistently
Dollar-cost averaging (DCA) means investing a predetermined amount at regular intervals rather than attempting to predict the perfect market entry point.
When prices are higher, the same amount buys fewer units. When prices are lower, it buys more.
The approach does not eliminate market risk, but it can reduce the need to make repeated timing decisions.
Diversify globally
A broadly diversified global portfolio reduces dependence on any individual company or country.
Indexes such as FTSE All-World or MSCI ACWI IMI provide exposure to many companies across multiple markets. See Investing in ETFs. Diversification cannot prevent losses during a global equity-market decline, but it reduces concentration in individual holdings.
Have a plan for bear markets
A long-term strategy should account for the possibility of substantial declines.
The important question is not whether a bear market will occur, but whether your portfolio and financial plan are structured so that you can continue following your strategy when it does.
What returns can you realistically expect?
Historical performance cannot guarantee future results.
For the coming decades, the source uses 7.5–8.5% nominal annual returns as a long-term expectation for a globally diversified equity portfolio similar to the FTSE All-World.
With inflation of approximately 2.5–3%, that corresponds to roughly 5–5.5% real annual returns.
At a 5% real annual return, purchasing power approximately doubles in around 14–15 years. At a 5.5% real return, the period is somewhat shorter.
These figures are useful as planning assumptions, but actual future returns can be substantially higher or lower over any particular period.
The power of compounding
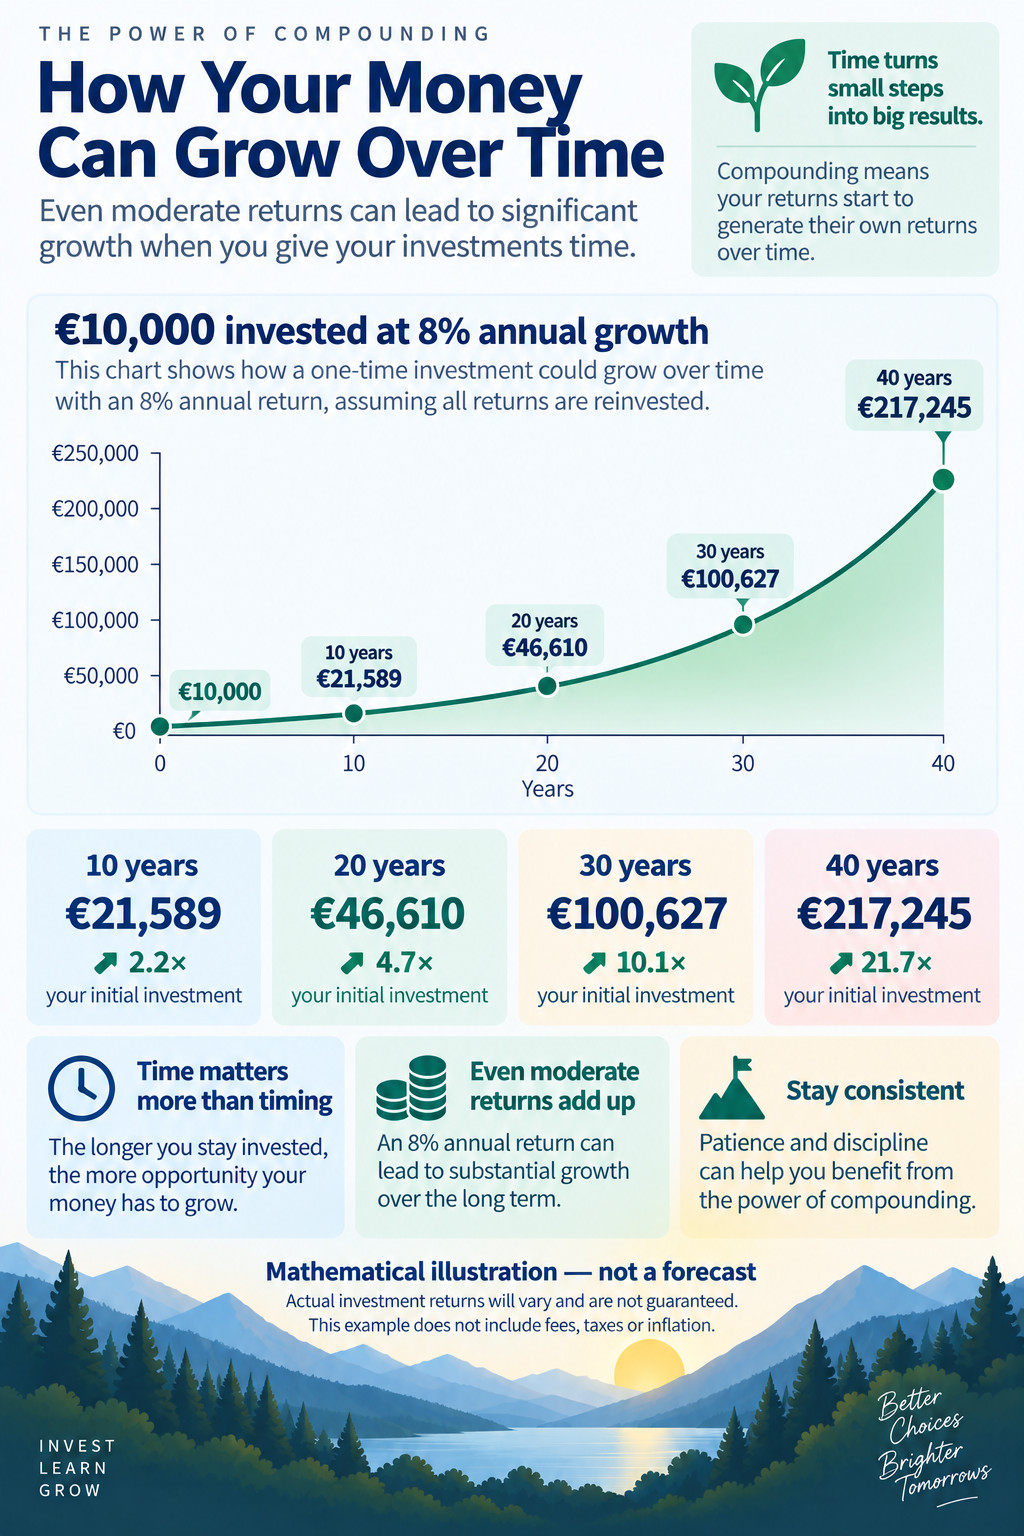
Compounding becomes increasingly powerful as the investment period grows.
For example, a hypothetical €10,000 investment growing at 8% annually would become approximately:
These are mathematical illustrations, not forecasts. They assume a constant 8% annual return and ignore taxes, fees, inflation, and the fact that real markets fluctuate from year to year.
In reality, investment returns are uneven. The long-term result depends on the sequence of gains and losses, contributions, withdrawals, fees, taxes, and investor behaviour.
Key takeaways
- Long-term historical equity returns have been positive, but annual returns can vary dramatically.
- The source uses approximately 10% nominal annual returns for the S&P 500 and 7.5–8.5% for a globally diversified FTSE All-World portfolio as historical reference points.
- Real returns matter because inflation reduces purchasing power.
- Significant intra-year declines can occur even during years that finish with positive returns.
- Bear markets of 20% or more are a normal part of equity investing.
- Longer investment horizons give compounding more time to work, but they do not eliminate risk.
- Investor behaviour can create a large gap between market performance and actual investor results.
- Consistency, diversification, an appropriate time horizon, and a plan for market declines can help investors avoid emotionally driven decisions.
- Historical averages are useful for planning, but they are not promises about future returns.
Educational only — not personalised investment advice.